
The Market’s Gross Blind Spot: Why Record Leverage Is the Next Big Risk
Jun 3, 2025
gross-leverage-across-wall-street-is-at-its-highest-in-years-even-as-everyone-crowds-into-the-same-ai-fueled-trades-the-real-risk-now-isn-t-valuation-it-s-what-happens-if-everyone-tries-to-exit-at-once

What’s “Gross” in Markets Now? Why Top Traders Fear the Next Big Question Is Still Being Ignored
Wall Street’s historic leverage build-up, low risk premiums, and AI-fueled crowding are setting the stage for a sharp correction—if anyone dares to ask the right question.
The Problem: Markets Are Running Out of Room to Run
The S&P 500 is sitting at historically stretched valuation levels, with the index’s forward 12-month P/E holding steady near 21x (Goldman Sachs). But under the hood, the real story is leverage. Gross exposures across the trading world are at decade highs—even as most “left tail” (bearish) risks have been squeezed out and everyone is leaning bullish. As Goldman’s Shawn Tuteja warns, “the right tail is capped.”
Tight ERP (Equity Risk Premium): The gap between S&P 500 earnings yields and real 10-year Treasury yields is near record lows (FactSet). The market is simply not getting paid much to take on equity risk.
Overcrowded trades: The notional long-buying in US tech just hit a 10-year high, according to Goldman’s internal data (ZeroHedge article).
Charts to watch: S&P forward P/E (main), S&P EPS yield gap vs. Treasuries, net vs. gross leverage, momentum factor returns, and US tech crowding.

The Great Grossing: Why This Time Is Different
For most of 2024, the favored trade has been piling into secular growth names—AI, tech, megacaps—while betting against “lower quality” cyclicals. What’s different now is the sheer magnitude of gross exposure (total risk), not just net positioning. According to Goldman, grosses are at a “10/10” across both discretionary and systematic traders.
Everyone’s long, no one’s hedged: Even the more cautious players are running slightly higher gross than they’d like.
Momentum and crowding: The GS Momentum factor is up over 21% in just a few months, and the “crowding index” is up 10% since April.
Visual note: The original charts (S&P P/E, EPS yield gap, momentum factor, and crowding index) are critical to show how extreme these levels have become. Consider using these directly or building a custom Gamp Sheet visual with the same time-series look.
What No One Wants to Ask: “What If the Gross Reverses?”
Almost no one is prepared for a true “de-grossing”—a rush to unwind risk across the board. Goldman’s key concern: What actually triggers a rush for the exits? Some scenarios:
Disappointing economic headlines (e.g., NFP print, negative tariff news)
Sudden EU digital tax proposal
Major geopolitical event (Taiwan, Middle East, Russia)
Loss of AI/tech leadership (Nvidia/semis miss or guidance fade)
Because most traders are so leveraged, a relatively small negative shock could lead to a disproportionate selloff. This is how positioning becomes the risk.
“I do worry that the question that is not being asked is: ‘What could cause an equity de-grossing to happen?’” — Shawn Tuteja, Goldman Sachs
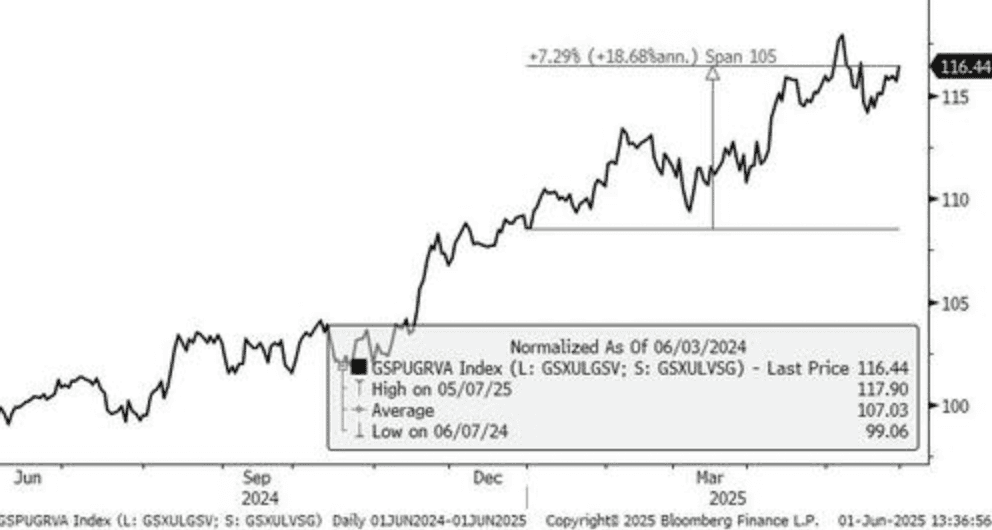
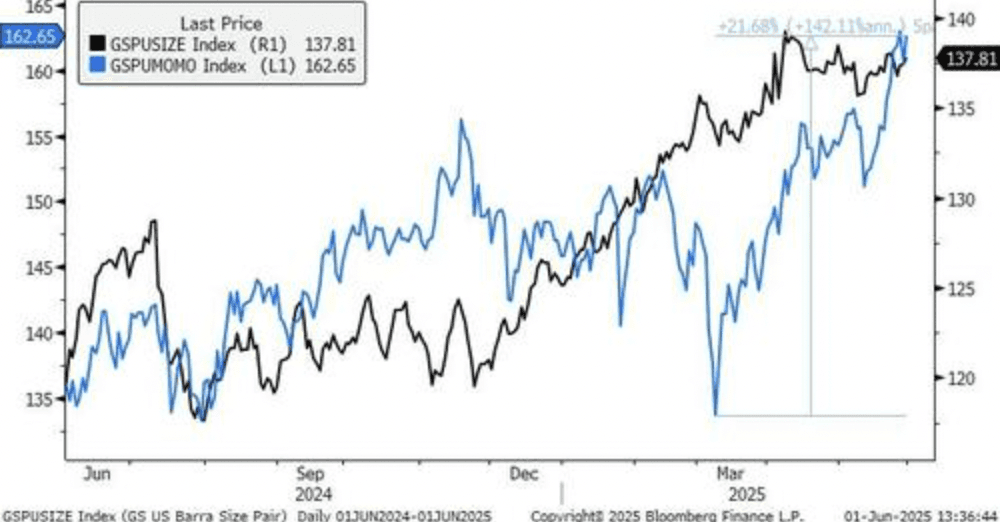
The Momentum factor (GSPUMOMO) is up over 21% in the past few months, and our growth vs value pair (GSPUGRVA) has the same trajectory
Why This Story Matters: The “All-In” Era Raises Systemic Risk
Today’s market is defined by its one-sidedness: everyone’s chasing the same trade, and almost nobody is hedged for a reversal. This is classic late-cycle risk—where “consensus” is strongest right before the fall. For anyone managing exposure in global equities, now is the time to challenge the crowd, not follow it.
Actionable Ideas: Protecting Against the Unexpected
Hedge with puts or put spreads on crowded factor indices like Momentum or high-growth tech (GS analysis).
Monitor crowding indexes and net/gross leverage data—when these start to fall, it’s usually not just profit-taking, but forced de-risking.
Watch for volatility spikes after “harmless” headlines—this can signal the start of de-grossing.
Visual Recommendations
Main Image: Custom chart overlay of S&P 500 forward P/E with a bold headline: “How Much Higher Can We Go?” or “Consensus Hits the Ceiling.”
Supporting Images:
Goldman/FactSet charts on S&P forward P/E, EPS yield gap, net vs. gross leverage, momentum factor returns.
Visual comparison of tech crowding now vs. past cycles (consider GS data or Bloomberg's Tech Bubble Visuals).
Brief infographic highlighting scenarios that could trigger a de-grossing.
In-Text Source Links
The Lean Revolution: Why America’s Biggest Companies Are Slashing White-Collar Jobs—and What It Means for the Global Economy ›
The Market’s Gross Blind Spot: Why Record Leverage Is the Next Big Risk
Jun 3, 2025
gross-leverage-across-wall-street-is-at-its-highest-in-years-even-as-everyone-crowds-into-the-same-ai-fueled-trades-the-real-risk-now-isn-t-valuation-it-s-what-happens-if-everyone-tries-to-exit-at-once
What’s “Gross” in Markets Now? Why Top Traders Fear the Next Big Question Is Still Being Ignored
Wall Street’s historic leverage build-up, low risk premiums, and AI-fueled crowding are setting the stage for a sharp correction—if anyone dares to ask the right question.
The Problem: Markets Are Running Out of Room to Run
The S&P 500 is sitting at historically stretched valuation levels, with the index’s forward 12-month P/E holding steady near 21x (Goldman Sachs). But under the hood, the real story is leverage. Gross exposures across the trading world are at decade highs—even as most “left tail” (bearish) risks have been squeezed out and everyone is leaning bullish. As Goldman’s Shawn Tuteja warns, “the right tail is capped.”
Tight ERP (Equity Risk Premium): The gap between S&P 500 earnings yields and real 10-year Treasury yields is near record lows (FactSet). The market is simply not getting paid much to take on equity risk.
Overcrowded trades: The notional long-buying in US tech just hit a 10-year high, according to Goldman’s internal data (ZeroHedge article).
Charts to watch: S&P forward P/E (main), S&P EPS yield gap vs. Treasuries, net vs. gross leverage, momentum factor returns, and US tech crowding.
The Great Grossing: Why This Time Is Different
For most of 2024, the favored trade has been piling into secular growth names—AI, tech, megacaps—while betting against “lower quality” cyclicals. What’s different now is the sheer magnitude of gross exposure (total risk), not just net positioning. According to Goldman, grosses are at a “10/10” across both discretionary and systematic traders.
Everyone’s long, no one’s hedged: Even the more cautious players are running slightly higher gross than they’d like.
Momentum and crowding: The GS Momentum factor is up over 21% in just a few months, and the “crowding index” is up 10% since April.
Visual note: The original charts (S&P P/E, EPS yield gap, momentum factor, and crowding index) are critical to show how extreme these levels have become. Consider using these directly or building a custom Gamp Sheet visual with the same time-series look.
What No One Wants to Ask: “What If the Gross Reverses?”
Almost no one is prepared for a true “de-grossing”—a rush to unwind risk across the board. Goldman’s key concern: What actually triggers a rush for the exits? Some scenarios:
Disappointing economic headlines (e.g., NFP print, negative tariff news)
Sudden EU digital tax proposal
Major geopolitical event (Taiwan, Middle East, Russia)
Loss of AI/tech leadership (Nvidia/semis miss or guidance fade)
Because most traders are so leveraged, a relatively small negative shock could lead to a disproportionate selloff. This is how positioning becomes the risk.
“I do worry that the question that is not being asked is: ‘What could cause an equity de-grossing to happen?’” — Shawn Tuteja, Goldman Sachs
The Momentum factor (GSPUMOMO) is up over 21% in the past few months, and our growth vs value pair (GSPUGRVA) has the same trajectory
Why This Story Matters: The “All-In” Era Raises Systemic Risk
Today’s market is defined by its one-sidedness: everyone’s chasing the same trade, and almost nobody is hedged for a reversal. This is classic late-cycle risk—where “consensus” is strongest right before the fall. For anyone managing exposure in global equities, now is the time to challenge the crowd, not follow it.
Actionable Ideas: Protecting Against the Unexpected
Hedge with puts or put spreads on crowded factor indices like Momentum or high-growth tech (GS analysis).
Monitor crowding indexes and net/gross leverage data—when these start to fall, it’s usually not just profit-taking, but forced de-risking.
Watch for volatility spikes after “harmless” headlines—this can signal the start of de-grossing.
Visual Recommendations
Main Image: Custom chart overlay of S&P 500 forward P/E with a bold headline: “How Much Higher Can We Go?” or “Consensus Hits the Ceiling.”
Supporting Images:
Goldman/FactSet charts on S&P forward P/E, EPS yield gap, net vs. gross leverage, momentum factor returns.
Visual comparison of tech crowding now vs. past cycles (consider GS data or Bloomberg's Tech Bubble Visuals).
Brief infographic highlighting scenarios that could trigger a de-grossing.
In-Text Source Links
The Lean Revolution: Why America’s Biggest Companies Are Slashing White-Collar Jobs—and What It Means for the Global Economy ›